
How stock returns are created: price, dividends, dilution, and corporate actions
Decompose stock returns into business performance, valuation change, dividends, buybacks, dilution, splits, mergers, spin-offs, and other corporate actions.
This guide covers:
- Break stock return into business performance, distributions, dilution, and valuation change.
- How corporate actions can change per-share outcomes.
- Reconcile return arithmetic before interpreting the price chart.
Review these foundations before moving into the details.
Separate business return, market return, and corporate actions
Shareholder return is not just the change in a price chart. Earnings and cash-flow growth, valuation multiples, distributions, share-count changes, and corporate actions all alter the investor’s economic result.
- How much of return came from business growth versus a change in valuation?
- Did dividends, repurchases, issuance, or dilution change per-share economics?
- How should splits, mergers, spin-offs, or other corporate actions be reflected in the return record?
01SECTION 01 · 3 MINHow stock returns are created
A shareholder’s total return comes mainly from price change plus cash distributions. The business can create value by growing revenue, expanding margins, reinvesting at attractive returns, reducing debt, paying dividends, or repurchasing shares at sensible prices. The market can add or subtract from that return by changing the valuation multiple investors are willing to pay.
How stock returns are created
A shareholder’s total return comes mainly from price change plus cash distributions. The business can create value by growing revenue, expanding margins, reinvesting at attractive returns, reducing debt, paying dividends, or repurchasing shares at sensible prices. The market can add or subtract from that return by changing the valuation multiple investors are willing to pay.
How the arithmetic works
If an investor buys at $80, receives $2 of dividends, and later sells at $92, the gain before fees and taxes is $14 per share. That is a 17.5% total return on the original $80. The same company could report higher earnings while the stock falls if investors decide the original price assumed too much growth.
Total return: measure the whole economic result, not only the price chart
A price chart shows only one part of an investment outcome. For stocks and funds that distribute cash, a useful performance review starts with the change in market value and adds dividends or other distributions, then considers fees, taxes, reinvestment, and the period over which the return was earned.
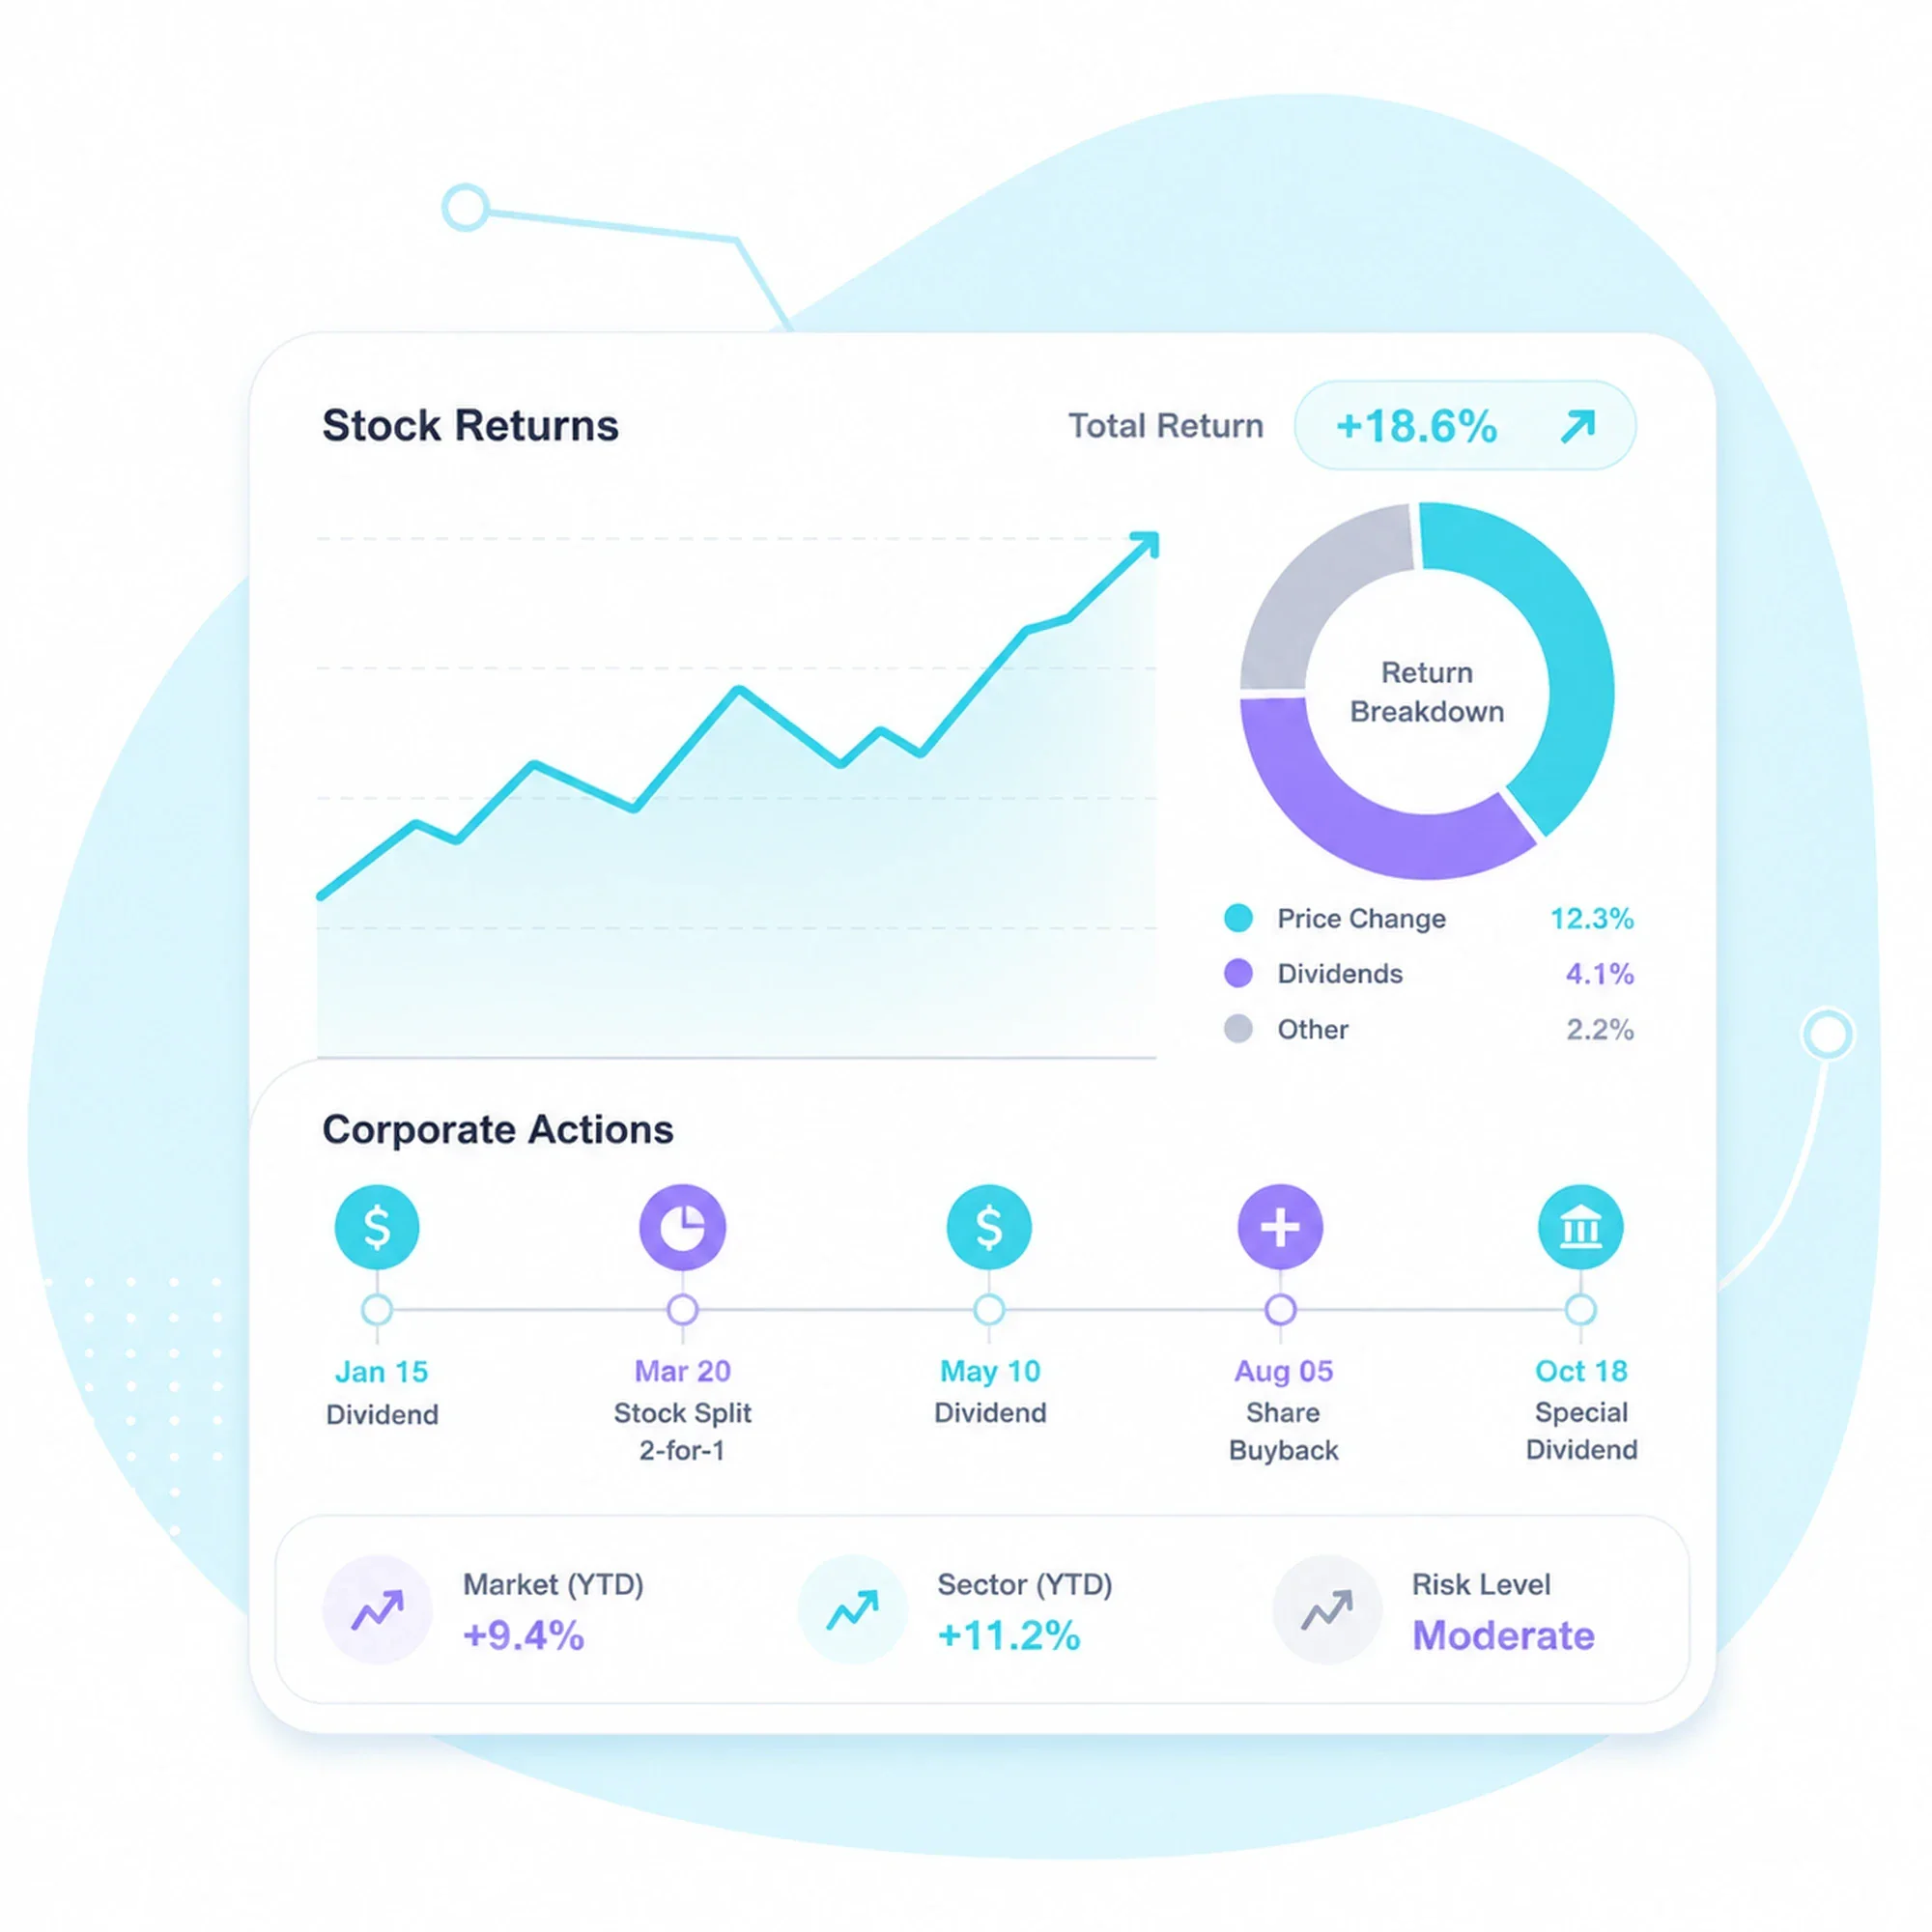
- Total return combines price change with cash distributions received during the measurement period.
- Reinvested distributions can change the ending value, so compare price-return and total-return series carefully.
- Fees, taxes, withholding, trading friction, and currency conversion can make the investor's realized result different from a published index or fund return.
- Use annualized return when comparing investments held for different lengths of time.
Read performance through four layers
A simple pre-cost example
If a stock rises from $50 to $54 and pays $1 per share in dividends during the holding period, the economic gain is $5 per share before fees and taxes. Relative to the $50 starting value, that is a 10% total return. Looking only at the price change would report 8% and miss the cash distribution.
Income-oriented stocks, bond funds, and dividend-paying funds may distribute a meaningful part of their return rather than leaving all value growth in the quoted price.
the investor's holding period, contribution and withdrawal timing, taxes, account type, fees, and home-currency exchange rate can all change the result experienced in the account.
02SECTION 02 · 2 MINA stock trades on expectations, not on the headline number alone
Quarterly results contain several layers: reported revenue and earnings, cash flow, operating metrics, management guidance, changes to prior guidance, balance-sheet developments, capital allocation, and what management says about demand and costs. The market response depends on how those facts compare with expectations already embedded in the share price.
A stock trades on expectations, not on the headline number alone
Quarterly results contain several layers: reported revenue and earnings, cash flow, operating metrics, management guidance, changes to prior guidance, balance-sheet developments, capital allocation, and what management says about demand and costs. The market response depends on how those facts compare with expectations already embedded in the share price.
Before the report
Record consensus ranges, the company’s prior guidance, major operating drivers, valuation, options-implied volatility if relevant, and the question that matters most to the thesis. Do not rewrite expectations after seeing the result.
At the release
Separate revenue, margins, EPS, free cash flow, key operating metrics, and guidance. Identify one-time items and share-count changes before judging “beat” or “miss.” Separate the new facts from adjustments and guidance before interpreting the market reaction; the order decision comes only after the updated numbers are understood.
After the call
Compare management commentary with prior quarters, analyst estimate revisions, and the new valuation implied by the updated assumptions. A price decline after a “beat” can be rational if future expectations deteriorated.
03SECTION 03 · 2 MINWhat moves a stock price
A stock price reflects changing expectations about future cash flows and the return investors require to own those cash flows. Revenue growth, margins, competitive position, interest rates, inflation, balance-sheet risk, capital allocation, taxes, regulation, dilution, sentiment, positioning, and liquidity can all change the price. Separate changes in business fundamentals from changes in valuation. A company can report improving earnings while the stock falls if expectations were higher or if the market assigns a lower multiple to those earnings.
What moves a stock price
A stock price reflects changing expectations about future cash flows and the return investors require to own those cash flows. Revenue growth, margins, competitive position, interest rates, inflation, balance-sheet risk, capital allocation, taxes, regulation, dilution, sentiment, positioning, and liquidity can all change the price. Separate changes in business fundamentals from changes in valuation. A company can report improving earnings while the stock falls if expectations were higher or if the market assigns a lower multiple to those earnings.
04SECTION 04 · 2 MINDecompose a stock return into business, valuation, and cash distributions
Over a useful holding period, a stock’s total return can be understood conceptually as the interaction of growth in per-share fundamentals, changes in the valuation investors are willing to pay for those fundamentals, and cash returned to shareholders. The components can offset each other: a company can grow earnings while the stock falls if the valuation multiple contracts enough, or a slow-growing company can produce an acceptable return through dividends and disciplined capital allocation.
Decompose a stock return into business, valuation, and cash distributions
Over a useful holding period, a stock’s total return can be understood conceptually as the interaction of growth in per-share fundamentals, changes in the valuation investors are willing to pay for those fundamentals, and cash returned to shareholders. The components can offset each other: a company can grow earnings while the stock falls if the valuation multiple contracts enough, or a slow-growing company can produce an acceptable return through dividends and disciplined capital allocation.
- Per-share growth: focus on revenue, margins, cash flow, and share count, not only company-wide profit.
- Valuation: compare the starting and ending multiple and ask what growth, quality, rates, and risk the price assumes.
- Capital allocation: dividends and repurchases can return capital, while stock issuance and stock-based compensation can dilute each owner’s claim.
05SECTION 05 · 2 MINDividends, buybacks, dilution, and splits
Dividends transfer cash from the company to shareholders. A high dividend yield can be attractive, but a yield can rise because the stock price is falling and the dividend may be at risk. Review payout ratio, free cash flow, leverage, and the board’s capital priorities.
Dividends, buybacks, dilution, and splits
Dividends transfer cash from the company to shareholders. A high dividend yield can be attractive, but a yield can rise because the stock price is falling and the dividend may be at risk. Review payout ratio, free cash flow, leverage, and the board’s capital priorities.
Buybacks reduce shares outstanding when stock is repurchased and retired. They can increase each remaining shareholder’s percentage ownership, but only create value when the company can afford them and the repurchase price is sensible. Debt-funded or overpriced buybacks can weaken the business.
New issuance and stock compensation increase the share count and can dilute existing owners. Always compare growth in company earnings with growth in earnings per share and the fully diluted share count.
Stock splits change the number of shares and price per share mechanically. A split by itself does not change the company’s enterprise value or create economic value.
| Event | What can change | What to verify |
|---|---|---|
| Cash dividend | Cash leaves the company and the stock typically trades without the upcoming dividend from the ex-dividend date. | Declaration, ex-dividend, record, payment dates, amount, and tax treatment. |
| Stock split / reverse split | Share count and per-share price change mechanically. | Split ratio, effective date, option-contract adjustments, and fractional-share treatment. |
| Spinoff | Shareholders may receive shares in a separated business. | Distribution ratio, tax information, cost-basis allocation, and new-company fundamentals. |
| Merger / acquisition | Cash, stock, or mixed consideration may replace the original security. | Terms, approvals, expected closing, financing, regulatory conditions, and deal-break risk. |
| Tender / exchange offer | Investors may be invited to sell or exchange shares under specified terms. | Price, expiration, proration, conditions, withdrawal rights, and broker deadlines. |
| Rights offering | Existing holders may receive rights to buy additional shares. | Subscription price, ratio, transferability, expiration, and dilution if rights are not used. |
06SECTION 06 · 2 MINRead the dividend timeline before trading around a distribution
A cash dividend has several dates that answer different questions. The declaration date is when the board announces the dividend and its terms. The ex-dividend date determines which market purchases generally trade without the upcoming dividend. The record date identifies holders on the company’s records, and the payment date is when the distribution is paid. Settlement conventions connect these dates, so investors should not rely on an old rule of thumb when the settlement cycle changes.
Read the dividend timeline before trading around a distribution
A cash dividend has several dates that answer different questions. The declaration date is when the board announces the dividend and its terms. The ex-dividend date determines which market purchases generally trade without the upcoming dividend. The record date identifies holders on the company’s records, and the payment date is when the distribution is paid. Settlement conventions connect these dates, so investors should not rely on an old rule of thumb when the settlement cycle changes.
| Date | Meaning | Investor implication |
|---|---|---|
| Declaration | Board approves and announces the distribution. | Read amount, type of distribution, record/payment dates, and whether it is ordinary, special, stock, or another form. |
| Ex-dividend | Shares begin trading without entitlement to the upcoming dividend under applicable market rules. | The stock price can adjust for the distribution; the dividend is not a free return created by buying immediately before this date. |
| Record | Company identifies holders entitled under its records. | Settlement mechanics determine which trades are reflected by the record date. |
| Payment | Cash or shares are distributed. | Confirm reinvestment instructions, taxes, and whether the cash is available or automatically reinvested. |
07SECTION 07 · 2 MINUse a corporate-action calendar so mechanical events do not look like investment signals
A public company can raise additional equity after its IPO through registered offerings, at-the-market programs, employee compensation, convertibles, acquisition shares, or other issuance. The key question is not simply whether the share count rises; it is whether the capital raised creates enough incremental value to offset dilution.
Use a corporate-action calendar so mechanical events do not look like investment signals
A public company can raise additional equity after its IPO through registered offerings, at-the-market programs, employee compensation, convertibles, acquisition shares, or other issuance. The key question is not simply whether the share count rises; it is whether the capital raised creates enough incremental value to offset dilution.
- Compare basic and diluted weighted-average shares with period-end shares outstanding.
- Read stock-compensation, option, restricted-stock, convertible, and warrant disclosures.
- Identify the cash raised or expense avoided in exchange for the new shares.
- Estimate how much revenue, free cash flow, or balance-sheet improvement the new capital must create.
- Recalculate per-share valuation using a realistic diluted share count.
08SECTION 08 · 2 MINFollow-on issuance can fund growth and still dilute each existing share
A follow-on offering can issue new primary shares, sell shares held by existing owners, or combine both. Primary issuance increases the company’s cash but also increases share count unless the capital creates enough value to offset dilution. Secondary shares sold by existing holders generally change ownership without adding new cash to the company.
Follow-on issuance can fund growth and still dilute each existing share
A follow-on offering can issue new primary shares, sell shares held by existing owners, or combine both. Primary issuance increases the company’s cash but also increases share count unless the capital creates enough value to offset dilution. Secondary shares sold by existing holders generally change ownership without adding new cash to the company.
Recalculate enterprise value, equity value, cash, debt, diluted shares, and per-share metrics after the deal. Review use of proceeds, issuance price/discount, underwriter option, shareholder lockups, shelf registration capacity, convertibles or warrants, and whether repeated issuance is financing attractive growth or covering a structurally cash-burning model.
Separate business growth, valuation change, cash distributions, and dilution
A company can grow while the stock performs poorly, or the stock can rise while underlying business progress is modest. Decompose the shareholder result so the reason is visible.
| Driver | How it affects the shareholder |
|---|---|
| Business growth | Revenue, margins, cash flow, assets, or other economic results change |
| Valuation | The price investors are willing to pay for a dollar of earnings, cash flow, book value, or another metric changes |
| Cash distributions | Dividends or other distributions add to total return but reduce company cash when paid |
| Buybacks / issuance | Share count can fall or rise; value creation depends on price, funding, and the business economics, not the word “buyback” alone |
| Corporate actions | Splits change units, mergers/spin-offs change ownership structure, and special transactions can change basis or security terms |
Simple total-return check
If a stock begins at $50, ends at $54, and pays $1 in dividends during the period, the simple pre-tax holding-period return is about 10%: a $4 price gain plus $1 distribution on the $50 starting value. This example ignores reinvestment, taxes, fees, and timing.
Shareholder return is more than the stock-price chart
An investor’s economic return can come from price appreciation and cash distributions, while dilution, repurchases, splits, mergers, spin-offs, and other corporate actions can change the number or nature of shares owned. A split changes the unit count and price per share but does not by itself create economic value.
Use filings and account records to reconcile corporate actions with cost basis and share count. Repurchases can increase each remaining share’s claim on the business if shares are retired at sensible prices, but issuing equity for compensation or acquisitions can offset that effect.
- Measure total return with distributions, not price alone.
- Track share-count change alongside repurchase announcements.
- Update basis and lot records after mergers, spin-offs, and other reorganizations.
Review the key points
1. How should business return, market return, and corporate actions be separated?
Shareholder return is not just the change in a price chart. Earnings and cash-flow growth, valuation multiples, distributions, share-count changes, and corporate actions all alter the investor’s economic result.
2. How stock returns are created.
A shareholder’s total return comes mainly from price change plus cash distributions. The business can create value by growing revenue, expanding margins, reinvesting at attractive returns, reducing debt, paying dividends, or repurchasing shares at sensible prices. The market can add or subtract from that return by changing the valuation multiple investors are willing to pay.
3. How the arithmetic works.
If an investor buys at $80, receives $2 of dividends, and later sells at $92, the gain before fees and taxes is $14 per share. That is a 17.5% total return on the original $80. The same company could report higher earnings while the stock falls if investors decide the original price assumed too much growth.